Exporting Grid Data to Excel file | Bryntum
Exporting Grid Data to Excel file | Bryntum
Published on: January 20, 2025
Author: Hamza Khattak
Tags: Bryntum, JavaScript, Excel, Data Export, Grid
Bryntum Grid is a powerful JavaScript component for displaying and managing tabular data. One common requirement is exporting grid data to Excel format for further analysis or reporting. This guide demonstrates how to implement Excel export functionality in Bryntum Grid with practical examples and best practices.
Overview
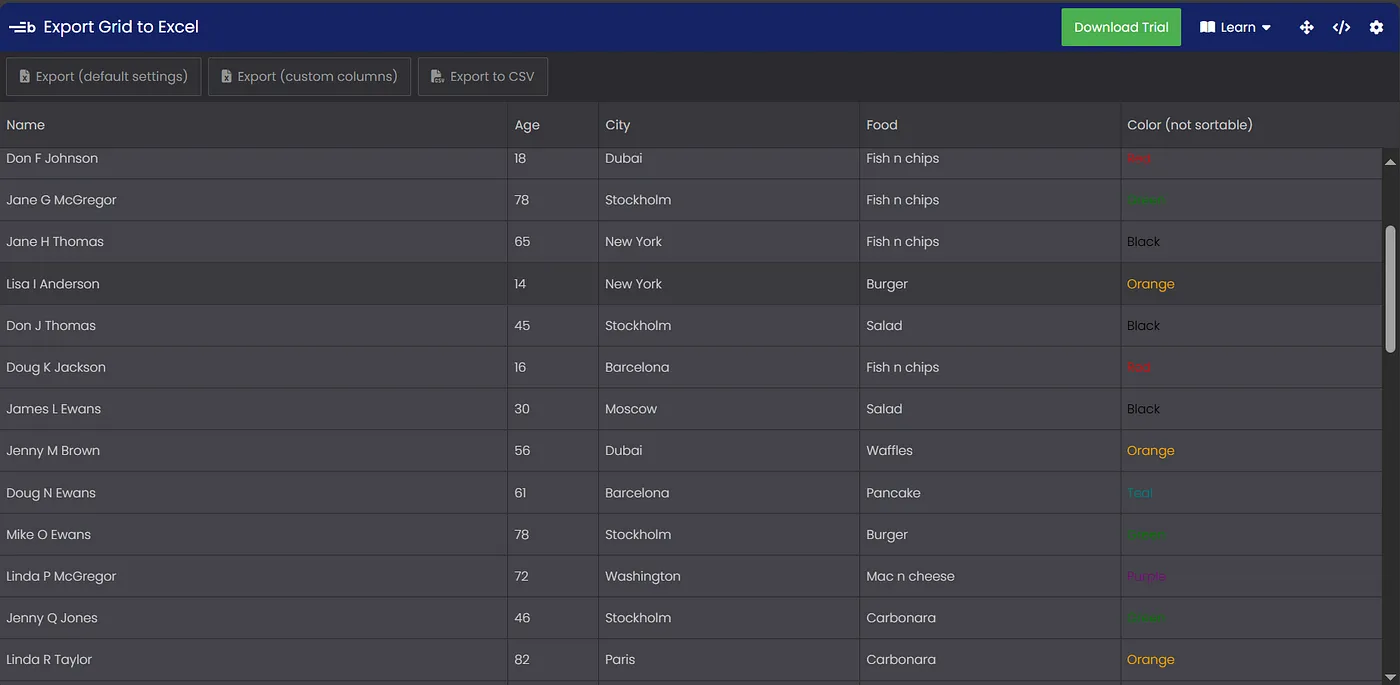
Bryntum Grid provides built-in support for exporting data to Excel format (.xlsx). The export feature is part of the GridExcelExporter class and can be easily integrated into your application.

Basic Setup
Installing Dependencies
First, ensure you have the Bryntum Grid package installed with Excel export support. You can install it using npm:
npm install @bryntum/grid @bryntum/grid-export
// Or using yarn
yarn add @bryntum/grid @bryntum/grid-export
Grid Configuration
Configure your Bryntum Grid with the Excel export feature enabled:
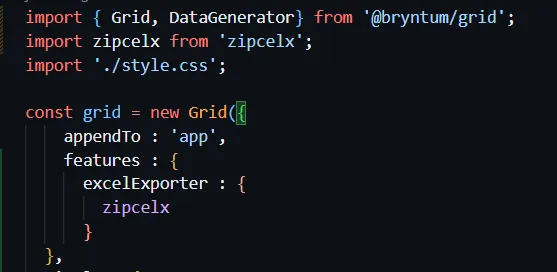
import { Grid } from '@bryntum/grid';
import { ExcelExporter } from '@bryntum/grid-export';
// Initialize the grid with export capabilities
const grid = new Grid({
appendTo: document.body,
features: {
excelExporter: true
},
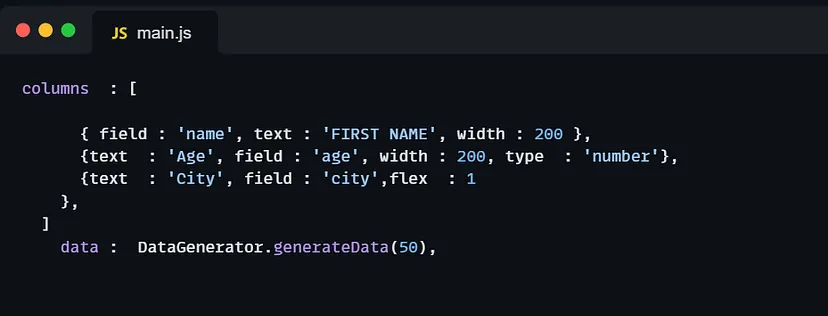
columns: [
{ field: 'name', text: 'Name' },
{ field: 'email', text: 'Email' },
{ field: 'city', text: 'City' }
],
data: [
{ id: 1, name: 'John Doe', email: 'john@example.com', city: 'New York' },
{ id: 2, name: 'Jane Smith', email: 'jane@example.com', city: 'Boston' },
{ id: 3, name: 'Bob Johnson', email: 'bob@example.com', city: 'Chicago' }
]
});
Implementation Steps
1. Import Required Modules
Import the necessary Bryntum modules including the Grid and ExcelExporter:
import { Grid, ExcelExporter } from '@bryntum/grid';
// For React applications
import { BryntumGrid, BryntumExcelExporter } from '@bryntum/grid-react';
2. Configure the Grid
Set up your grid with columns, data, and export configuration:
// Create the export button in your toolbar
const grid = new Grid({
appendTo: document.body,
tbar: [
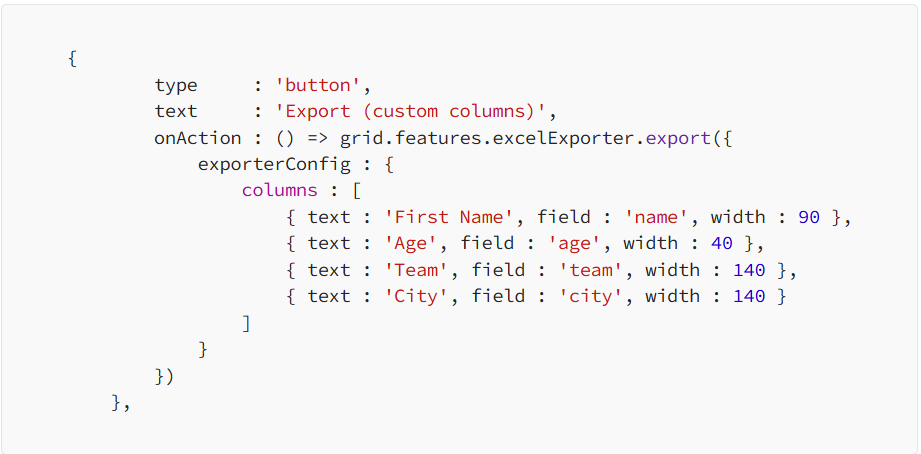
{
type: 'button',
text: 'Export to Excel',
icon: 'b-fa b-fa-file-excel',
onClick: () => {
grid.features.excelExporter.export({
filename: 'GridData.xlsx',
exporterConfig: {
// Excel export configuration
sheet: {
name: 'Grid Data'
}
}
});
}
}
],
// Rest of grid configuration
});
Customization Options
Export Settings
You can customize various aspects of the Excel export:
- Filename - Specify the exported file name
- Sheet Name - Set the Excel worksheet name
- Date Format - Control how dates are formatted
- Number Format - Configure number formatting
- Column Width - Adjust column widths in the exported file
// Advanced export configuration
grid.features.excelExporter.export({
    filename: 'SalesReport.xlsx',
    exporterConfig: {
        sheet: {
            name: 'Sales Data'
        },
        columns: {
            // Column-specific configurations
            date: {
                dateFormat: 'YYYY-MM-DD'
            },
            price: {
                numberFormat: '#,##0.00',
                width: 120
            }
        },
        // Add header with company information
        header: {
            rows: [
                {
                    cells: [
                        { value: 'Company Sales Report', style: { fontSize: 16, bold: true } }
                    ]
                },
                {
                    cells: [
                        { value: 'Generated on: ' + new Date().toLocaleDateString() }
                    ]
                }
            ]
        }
    }
});
Styling and Formatting
The exported Excel file can include:
- Cell Styling - Colors, fonts, and borders
- Header Formatting - Custom header styles
- Data Formatting - Conditional formatting based on data values

Advanced Features
Multi-Sheet Export
Export data to multiple sheets within a single Excel file:
// Multi-sheet export example
exporter.export({
    filename: 'CompanyData.xlsx',
    sheets: [
        {
            name: 'Sales',
            grid: salesGrid
        },
        {
            name: 'Inventory',
            grid: inventoryGrid
        },
        {
            name: 'Customers',
            grid: customerGrid
        }
    ]
});
Custom Data Processing
Transform or filter data before export using custom processing functions:
// Custom data processing before export
grid.features.excelExporter.export({
    filename: 'ProcessedData.xlsx',
    exporterConfig: {
        // Transform data before export
        processRow: (row, record) => {
            // Skip rows with "Confidential" flag
            if (record.confidential) {
                return false; // Exclude this row
            }

            // Add calculated fields
            if (record.revenue && record.costs) {
                row.profit = record.revenue - record.costs;
                row.margin = (row.profit / record.revenue * 100).toFixed(2) + '%';
            }

            return true; // Include this row with modifications
        }
    }
});
Progress Monitoring
Show export progress for large datasets:
// Export with progress monitoring
grid.features.excelExporter.export({
    filename: 'LargeDataset.xlsx',
    exporterConfig: {
        // Monitor export progress
        onProgress: (progress) => {
            // Update a progress bar
            progressBar.value = progress;

            // Show percentage
            statusText.innerHTML = `Exporting: ${Math.round(progress * 100)}%`;
        }
    }
});
Real-World Example
Here's a complete example showing how to implement Excel export in a React application:
import React, { useRef } from 'react';
import { BryntumGrid } from '@bryntum/grid-react';
import '@bryntum/grid/grid.stockholm.css';

const SalesReportGrid = () => {
    const gridRef = useRef(null);

    // Grid configuration
    const gridConfig = {
        columns: [
            { field: 'product', text: 'Product', flex: 2 },
            { field: 'region', text: 'Region', flex: 1 },
            {
                field: 'quantity',
                text: 'Quantity',
                align: 'right',
                renderer: ({ value }) => value.toLocaleString()
            },
            {
                field: 'unitPrice',
                text: 'Unit Price',
                align: 'right',
                renderer: ({ value }) => `$${value.toFixed(2)}`
            },
            {
                field: 'total',
                text: 'Total',
                align: 'right',
                renderer: ({ record }) => `$${(record.quantity * record.unitPrice).toFixed(2)}`
            }
        ],
        data: getSalesData(), // Your data source function
        features: {
            excelExporter: true,
            filterBar: true,
            group: 'region'
        },
        tbar: [
            {
                type: 'button',
                text: 'Export to Excel',
                icon: 'b-fa b-fa-file-excel',
                color: 'b-green',
                onClick: () => handleExport()
            }
        ]
    };

    // Export handler function
    const handleExport = () => {
        const grid = gridRef.current?.instance;

        if (grid) {
            grid.features.excelExporter.export({
                filename: 'SalesReport.xlsx',
                exporterConfig: {
                    // Include grouped headers
                    includeGroupHeaders: true,

                    // Export only visible rows (respecting filters)
                    onlyVisibleRows: true,

                    // Sheet configuration
                    sheet: {
                        name: 'Sales Report',
                        title: 'Company Sales Report',
                        titleStyle: {
                            fontSize: 18,
                            bold: true,
                            horizontalAlign: 'center'
                        }
                    },

                    // Column configurations
                    columns: {
                        unitPrice: {
                            width: 100,
                            headerStyle: { bold: true },
                            style: {
                                format: '$#,##0.00',
                                horizontalAlign: 'right'
                            }
                        },
                        total: {
                            width: 120,
                            headerStyle: { bold: true },
                            style: {
                                format: '$#,##0.00',
                                horizontalAlign: 'right',
                                // Conditional formatting
                                callback: ({ value }) => {
                                    if (value > 10000) {
                                        return { backgroundColor: '#e6ffec' };
                                    }
                                    if (value < 1000) {
                                        return { backgroundColor: '#ffebe6' };
                                    }
                                    return null;
                                }
                            }
                        }
                    }
                }
            });
        }
    };

    return (
        <div className="sales-grid-container">
            <h1>Sales Performance Report</h1>
            <BryntumGrid ref={gridRef} {...gridConfig} />
        </div>
    );
};

export default SalesReportGrid;
Browser Support
The Excel export feature works in all modern browsers that support:
- File API
- Web Workers (for large datasets)
- Download functionality
This includes Chrome, Firefox, Safari, and Edge (Chromium-based).
Performance Considerations
Optimization Tips
- Chunked Processing - Process large datasets in chunks to avoid freezing the UI
- Memory Management - Dispose of temporary objects after export to prevent memory leaks
- Async Operations - Use asynchronous processing for better UX during export operations
- Web Workers - Leverage web workers for heavy processing to keep the UI responsive
- Selective Export - Export only necessary data by implementing filtering or selection
Troubleshooting
Common Problems and Solutions
- Export button not working
Check that the excelExporter feature is properly configured and dependencies are correctly installed.
- Formatting issues in Excel
Verify column configurations and data types. Ensure date and number formats are correctly specified.
- Performance problems with large datasets
Implement pagination, filtering, or chunked processing. Consider using web workers for heavy operations.
- Missing data in export
Check that all required columns are included in the export configuration and that data is loaded properly.
Conclusion
Bryntum Grid's Excel export feature provides a robust and flexible solution for data export requirements. With proper configuration and customization, you can create professional Excel reports directly from your web application with minimal effort.
The export functionality can be further enhanced with custom styling, multiple sheets, and data transformations to meet specific business requirements. By following the best practices outlined in this guide, you can ensure optimal performance and user experience when implementing Excel export in your Bryntum Grid applications.
Working with Bryntum components? Check out my other tutorials on advanced Bryntum Grid features and integration patterns.